XGOALS MODEL
The xGoals Explorer explained properly
xGoals is more market-driven. It does not speak in narratives like Motives. It speaks through statistical pressure, confidence, stars, and market ladders.
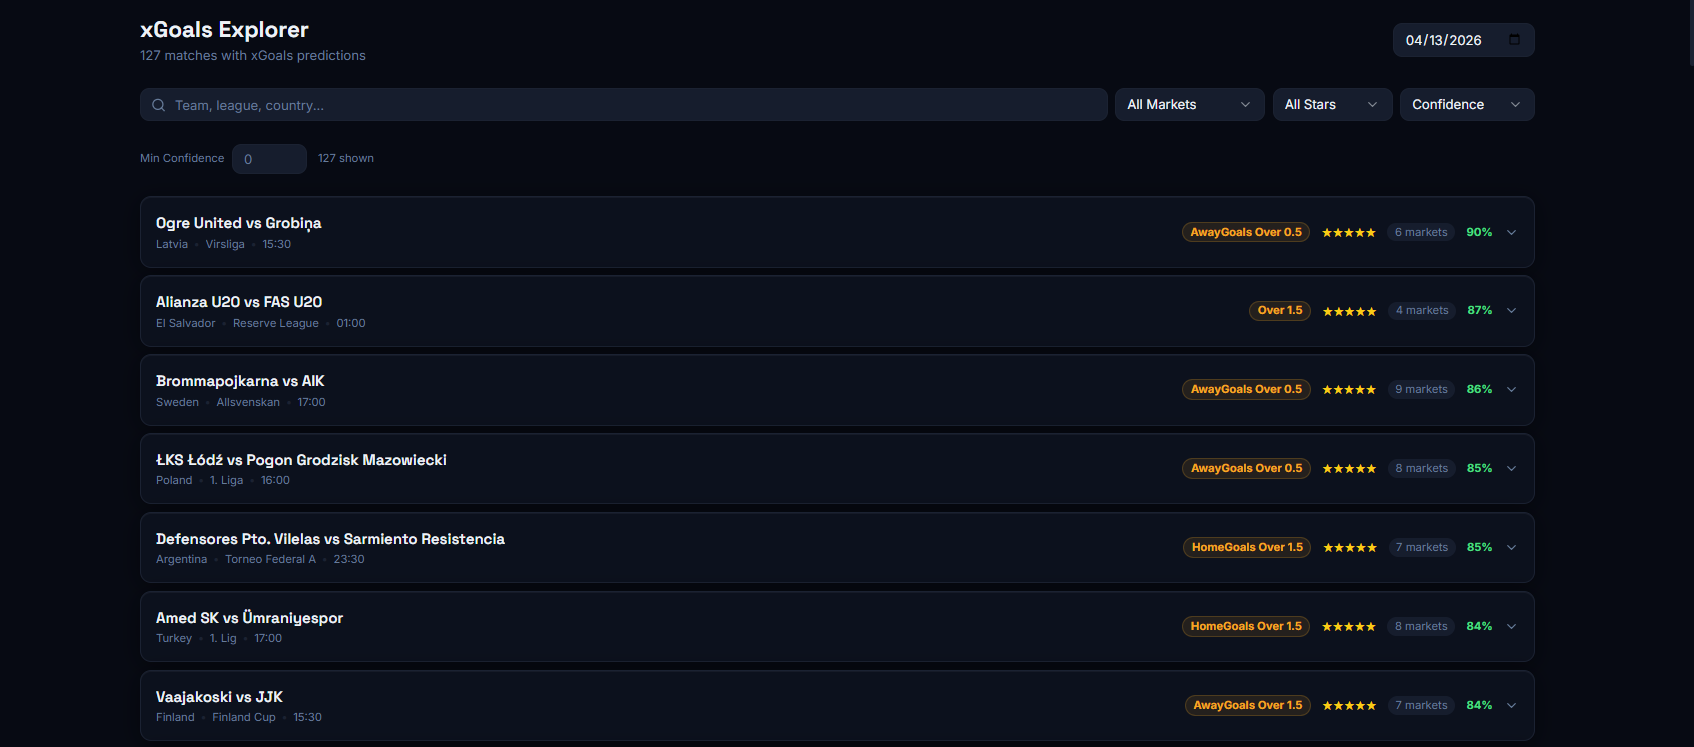
What you see in the first list
- Each match shows the top market the model leans toward
- Stars and confidence help you separate the stronger cases
- The number of markets shows how deep the market panel is for that match
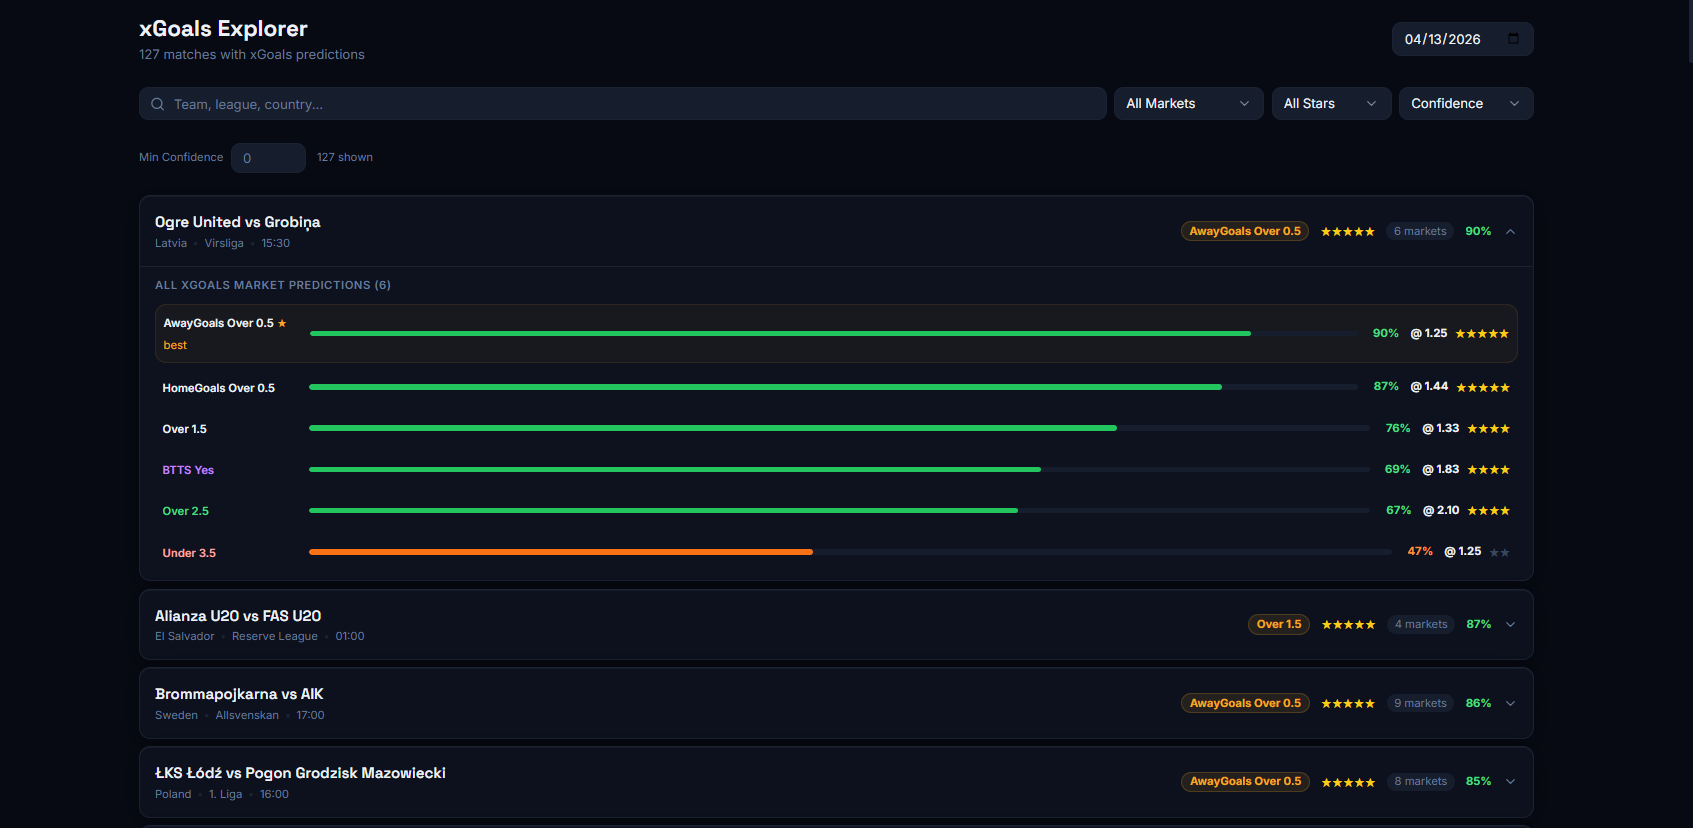
When you open the panel
The open xGoals panel shows all market predictions for the match. Not only the best market. That lets you read the ladder of possible markets and see where the real strength sits.
Green means a stronger projected market. Orange means a weaker or riskier market. The stars help you read depth and quality quickly.
What you are really reading
Market Pressure
Which markets have the strongest statistical push.
Stars
A quick indication of quality and strength for each market angle.
Confidence
Confidence shows how clearly the projection comes through.
Segments
The panel helps you see whether the match holds around one or two markets or opens into several.
Correct use
- Start from the match top market
- Open the panel to see whether related markets support it
- Do not read xGoals in isolation if Match Explorer gives the opposite picture
- Use it with Motives or AI Insights for a fuller picture